01 / What changed
A useful update. An important distinction.
A conversion report can improve for two very different reasons: your campaigns generated more purchases, or your tracking captured purchases that were already happening. Both deserve attention. They do not support the same budget decision. Before celebrating a higher conversion count, establish which explanation the evidence supports.
On 10 September, Google announced new first-party data integrations, conversion recovery reporting and Meridian updates. The changes span data collection, modeling and experiments. Their value comes from connecting those layers while understanding the different questions each one answers.[1]
| Capability | What Google announced | What to check |
|---|---|---|
| Data Manager | Google Analytics and DV360 integration, plus a universal API built on ECAPI. | Available sources, destinations and ownership. |
| Enhanced conversions | Expansion to Google Analytics and DV360. | Event definitions and matching setup. |
| Data Strength Uplift | A Google Ads metric showing conversions recovered through first-party signals. | Whether a reporting increase reflects improved capture. |
| Meridian & GeoX | Modeling improvements and global general availability of GeoX in Meridian. | Data readiness and experiment design. |
Inside Google Ads / Data Strength Uplift
View full size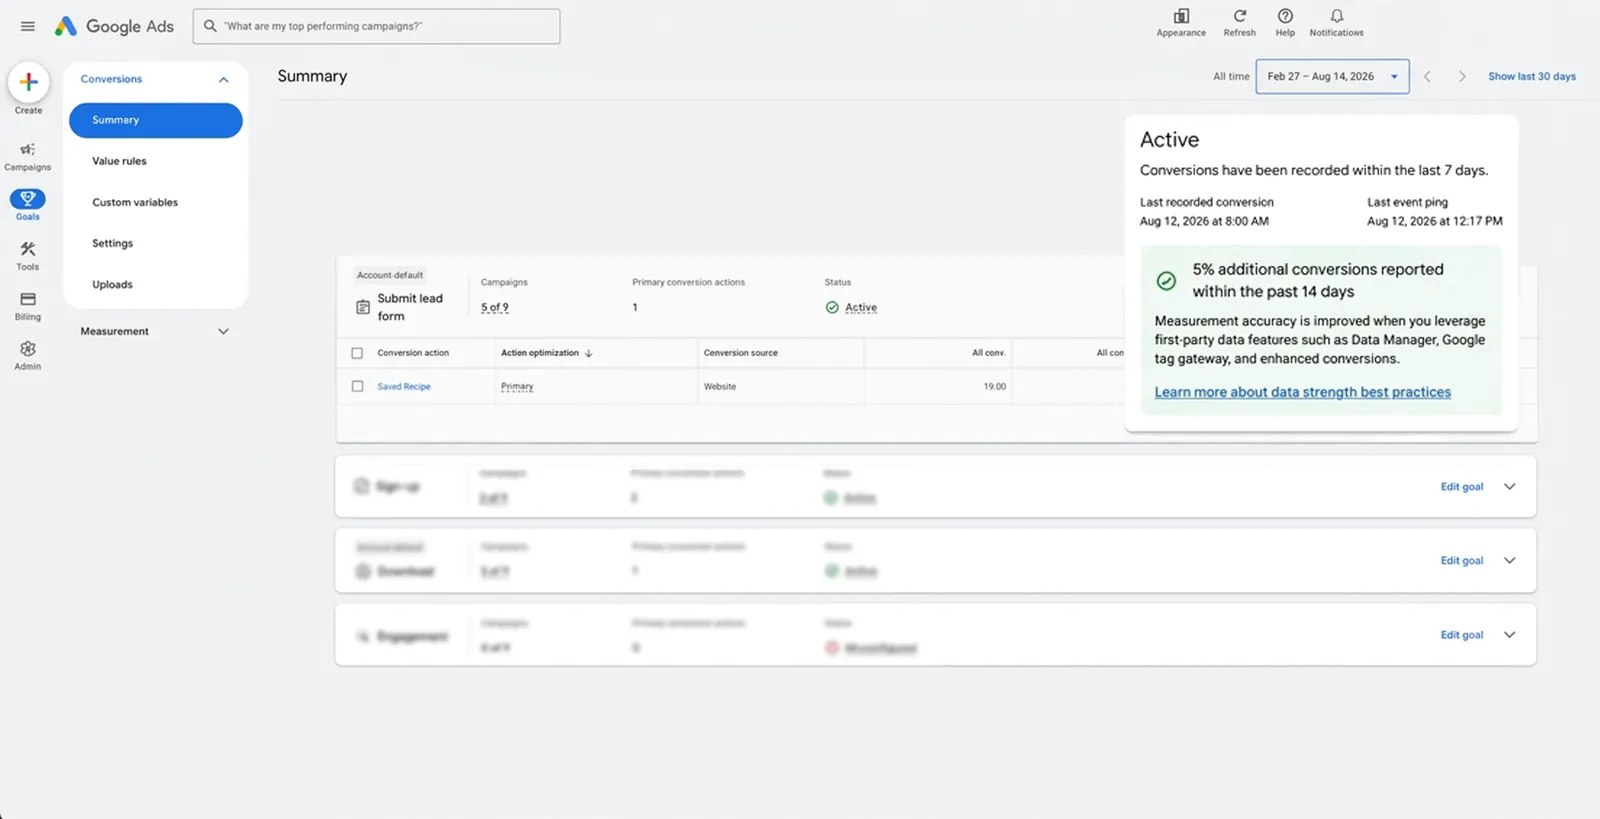
Start by checking what is available in your own account. An announcement is a reason to review the setup; it does not establish that every connection is ready or that your data needs no further work.
02 / Reporting vs growth
More measured purchases can mean the same sales.
Consider a fictional business completing 120 purchases in each period. Its tracking initially records 80. After a fix, it records 100. The report now contains 20 additional purchases, even though the business still completed 120. The extra visibility is useful, but those recovered records are not evidence of 20 new sales.
Illustrative example
Before the fix
After the fix
Purchases
Illustrative numbers only, not campaign results or a Google benchmark. Completed purchases remain at 120; recorded purchases rise from 80 to 100.
When a measurement change goes live, annotate the date beside your performance reporting. Record what changed and which metrics you expect it to affect. Otherwise, the next review may attribute a cleaner data pipeline to a campaign decision that did not cause the increase.
03 / The measurement framework
Give each layer a different job.
Data Manager provides a central way to connect sources and send data to destinations, including offline conversion imports and Customer Match. That makes it useful infrastructure for moving signals. Deciding what those signals establish about business impact remains an analytical task.[2]
- 01
Collect
Capture the right business events.
- 02
Reconcile
Explain differences across reports.
- 03
Evaluate
Estimate incremental impact.
- 04
Decide
Adjust spend with evidence.
An editorial workflow, not an automatic sequence inside Google Ads.
Meridian is an open-source marketing mix modeling framework. It can estimate channel contribution, response curves and budget allocation, subject to causal assumptions and model quality. Those assumptions, the input data and uncertainty around the estimates deserve attention before a model informs a spending decision.[3]
GeoX supports geographic experiments across publishers. Experiments can run independently or help calibrate a marketing mix model. A model and an experiment can inform one another, but they are different ways of building evidence, with different design requirements.[4]
Measurement in context / Meridian GeoX
View full size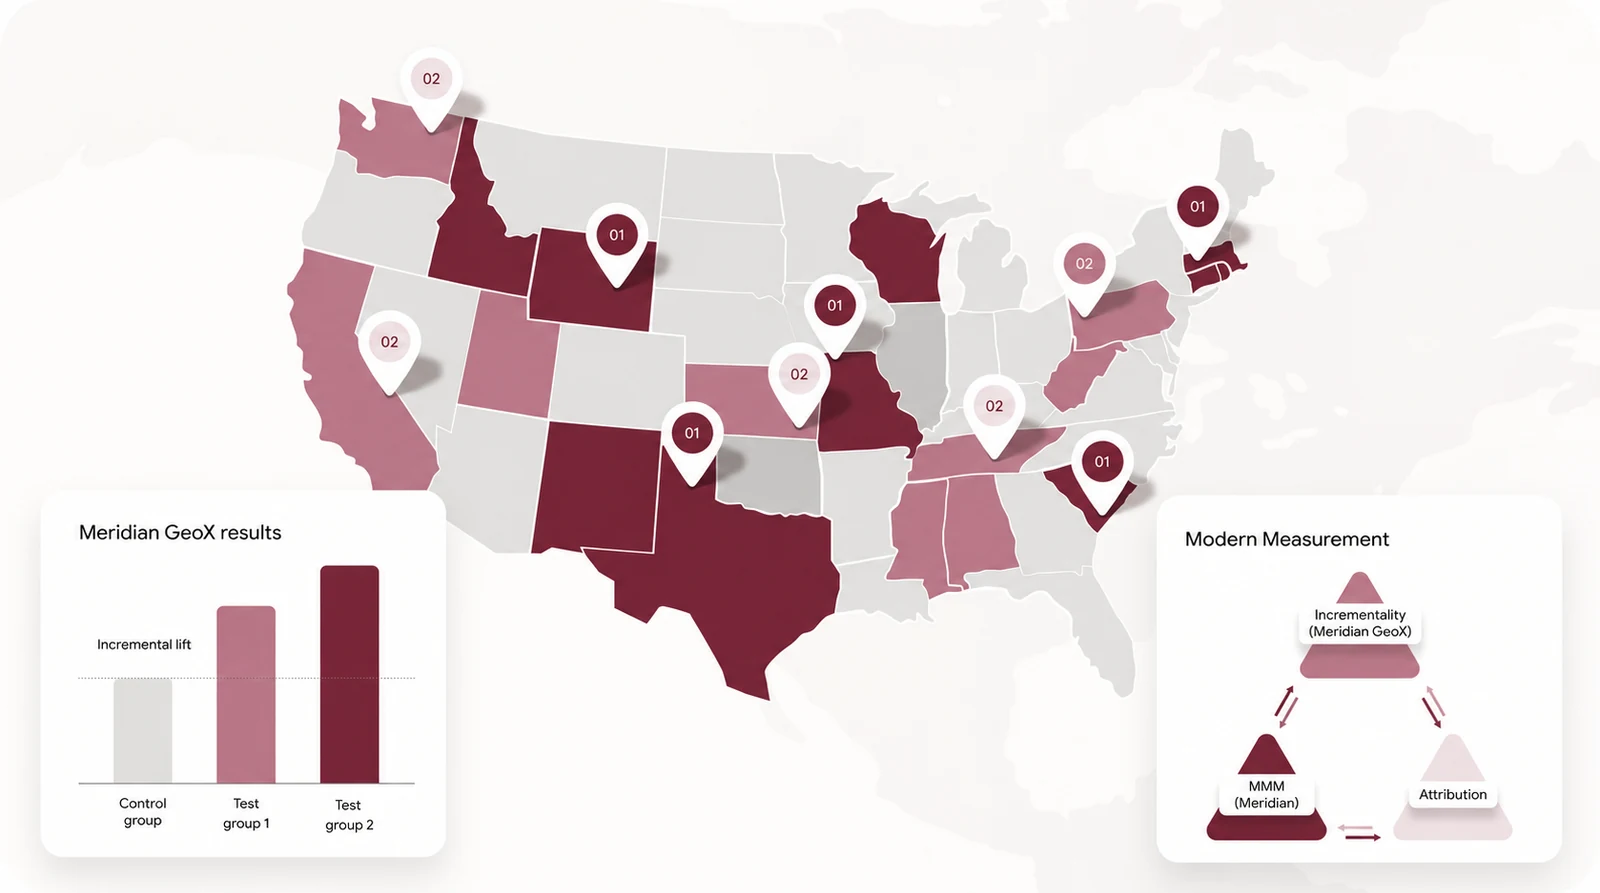
| Question | Useful evidence | Decision it informs |
|---|---|---|
| Are we capturing the event? | Event logs, diagnostics and a reconciled sample of business records. | Where to repair the data pipeline. |
| Which touchpoint receives credit? | Attribution reports with documented settings and definitions. | How to interpret reported channel performance. |
| What would happen without the ads? | An appropriate causal experiment or model with explicit assumptions. | Whether evidence supports a budget reallocation. |
04 / Your next account review
Start with a question you can actually answer.
Keep the first review small enough to finish. Pick one business outcome, follow it through the reporting process and agree how the evidence will change a decision. The following checklist is a suggested working approach, not a product requirement.
- 01
Define the business outcome.
Choose a purchase, qualified lead or closed revenue event. Document its definition and the person responsible for it.
- 02
Trace a sample from source to report.
Use permitted records to check missing events, duplicates, timing differences and values. Explain the gaps before combining totals.
- 03
Record the measurement change.
Keep the implementation date, affected conversion actions and expected reporting effect beside the baseline.
- 04
Choose evidence for the budget decision.
Agree the study outcome, comparison, duration and decision rule with your analyst. If the data cannot support the question yet, address that limitation first.
- 05
Automate the checks you understand.
Begin with a missing-data alert or a scheduled reconciliation. Give each alert an owner and a clear action so automation produces useful follow-through.
05 / The takeaway
Build confidence before you scale.
The most useful measurement setup produces numbers your team can explain. You should be able to say which events were captured, how credit was assigned and what evidence supports a claim of incremental impact. That clarity makes platform updates easier to evaluate and automation easier to trust.
For your next review, aim to leave with one agreed event definition, one documented path from source to report and one decision the evidence can support. That is a practical foundation for a better budget conversation.
Sources & context
- [1]Google: new data strength and measurement updates
Product announcement · 10 September 2026
- [2]Google Ads Data Manager: overview
Official documentation · data sources and destinations
- [3]Meridian: introduction
Official documentation · modeling and assumptions
- [4]GeoX: geographic experiments
Official documentation · experiments and model calibration
Published 13 Sept 2026. Recommendations are the author’s analysis. The chart uses fictional values to explain a measurement concept.